
Breaking Down the Balance Sheet
Table of contents
- Breaking Down the Balance Sheet
- The balance sheet and what does it tell you about your business?
- The balance sheet, how to read and understand it
- The balance sheet and the accounting equation
- The balance sheet and the assets section: Understanding the company’s resources
- The balance sheet and the liabilities section: Understanding the company’s obligations
- The Balance sheet and the equity section: Understanding the net residuals (net assets)
- The balance sheet, how should you look at it?
- The balance sheet, measuring the company’s liquidity
- The balance sheet and measuring the company’s solvency
- Conclusion
- The balance sheet and FAQs
The balance sheet and what does it tell you about your business?
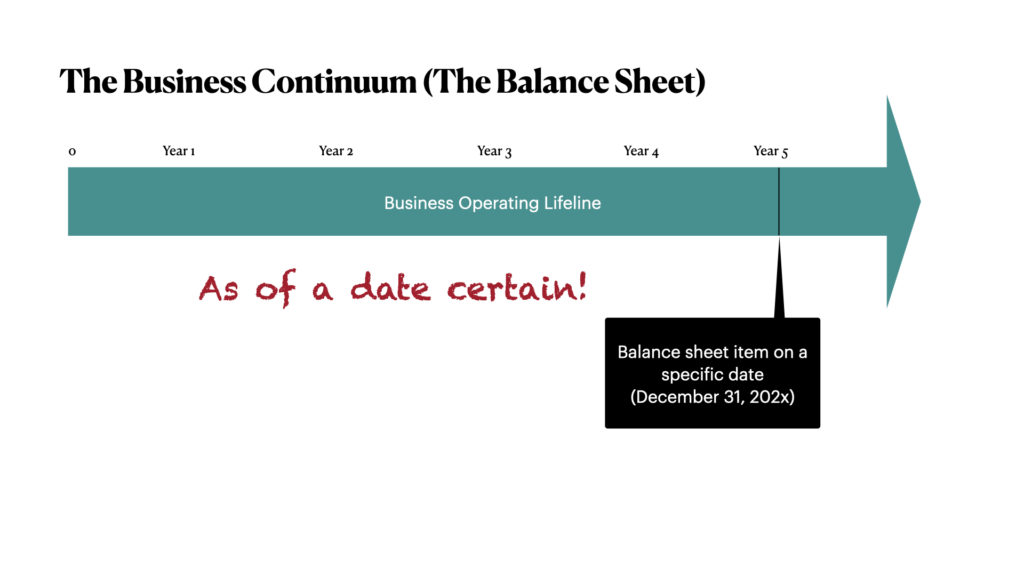
The balance sheet is an essential financial statement. The statement gives you a snapshot of your company’s financial health at a specific moment in time. It lists your business’s assets, liabilities, and equity. Also known as total footing, you can use balance sheet information to assess your company’s liquidity, solvency, and growth potential. Another name for the balance sheet is the statement of financial position. But did you know that the balance sheet tells you a story of the business?
The balance sheet reports a continuum
A balance sheet is one of the most important financial statements for a business. In a snapshot view of a company’s financial health, the report shows the balance sheet’s strengths and weaknesses.
What story can the balance sheet tell me about the company?
The balance sheet tells you the financial position of the business today. If the financial statements provide comparative financial information of more than one year, trends give a story. And with the balance sheet, the story of liquidity, leverage position, solvency, and growth is provided.
What does the financial position mean?
The company’s financial position means listing the business’s assets, liabilities, and equity. Some financial statements present the balance sheet as the statement of financial position.
Overall, the balance sheet is determined by the quality of assets and liabilities considered in assessing the business’s equity position.
The balance sheet, how to read and understand it
The balance sheet is a crucial financial statement that provides valuable insight into the health of your business. By looking at the balance sheet components, you can assess your company’s liquidity, solvency, and growth potential.
- Liquidity means your ability to make payments on or meet your financial obligations.
- Solvency refers to being able to pay your debts as they come due in the future while also leaving enough cash left over to allow you to continue investing in and growing your business.
- Growth potential measures how much more revenue you can bring in by expanding your product line, opening new locations, or taking other steps to grow your business.
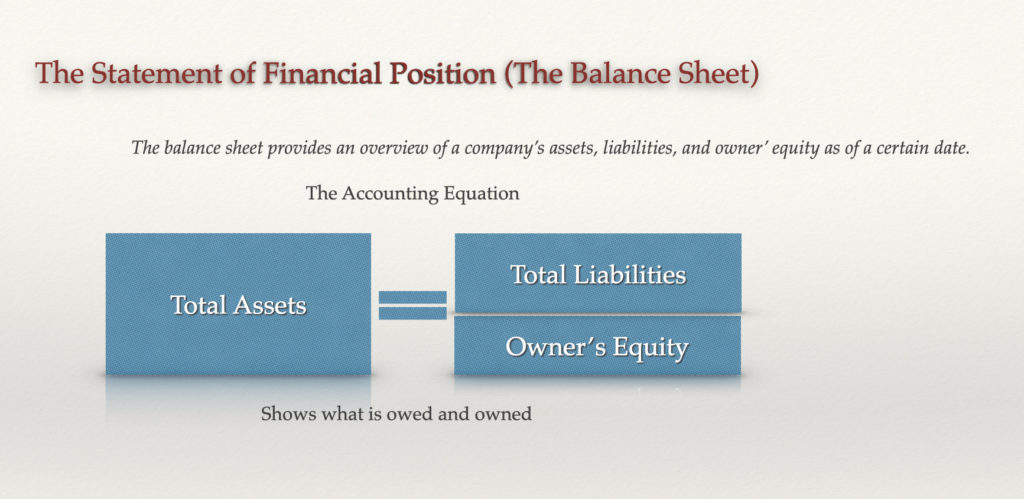
The balance sheet and the accounting equation
The balance sheet’s foundation is made up of the accounting equation, i.e., assets, liabilities, and equity. To read and understand your company’s balance sheet, you should first familiarize yourself with the accounting equation and its components:
Assets = Liabilities + Equity
- Assets refer to all of the company’s resources, such as cash, inventory, property, and equipment.
- Liabilities are the debts that the business owes to creditors, such as accounts payable or short-term loans from banks.
- Equity is a company’s net worth and indicates how much value you’ve created by investing in your business.
By carefully looking at the balance sheet and assessing each of these components, you can get a clear picture of your company’s financial health and make informed decisions about its future growth potential.
The balance sheet and the assets section: Understanding the company’s resources
Under generally accepted accounting principles of the United States, the presentation of assets reports from the most liquid assets to illiquid resources. Therefore, the asset section presents current and non-current assets.
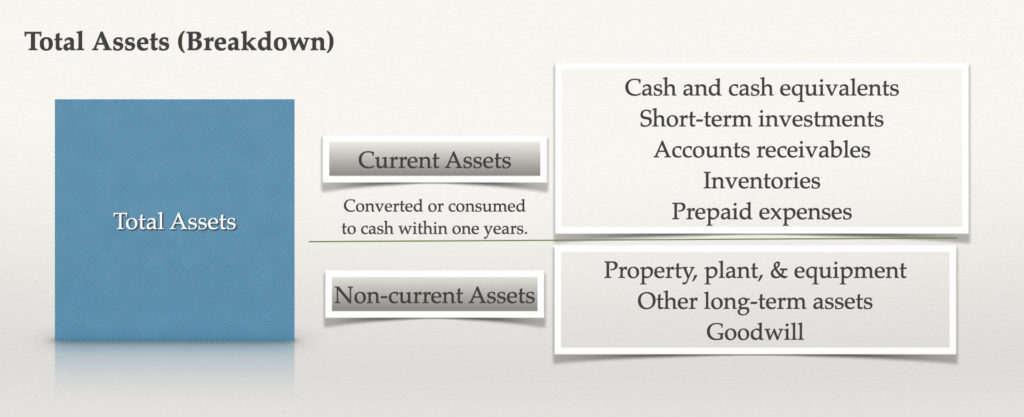
Current assets, the reported liquid assets
Current assets consist of cash and assets that can be quickly converted into cash. Overall, we are talking about short-term investments, accounts receivable, and inventory.
The current asset section is essential. Notwithstanding, it provides insight into a company’s ability to generate cash flow and meet its short-term obligations.
Essential current asset line items encompass:
- Cash and cash equivalents represent the cash on hand. It includes investments that can be quickly converted into cash, such as money market funds or short-term certificates of deposit
- Accounts receivables are the amounts owed to the company by its customers for goods or services provided
- Inventory includes the raw materials, work-in-progress, and finished goods that a company has on hand
- Prepaid expenses, which are the advance payments for goods or services to be received in the future
- Other current assets, which is a catch-all category for any other liquid assets not included in the above categories
Non-current assets, long-term investments
The second section of the assets portion of the balance sheet is non-current assets. Non-current assets include all of the company’s long-term resources. This includes property, plant, and equipment (PP&E), intangible assets, and long-term investments.
- Property, plant, and equipment are defined as the company’s physical assets. Fixed assets used in the business’s primary operations, such as manufacturing equipment or factory buildings.
- Intangible assets include intellectual property like patents and trademarks, goodwill, and other intangible assets.
- Long-term investments are funds invested in financial instruments that will not be converted to cash within one year. Long-term investments include long-term bonds, equity investments, and real estate.
Non-current assets tend to be less liquid than current assets and are primarily used to generate revenue for your company.
By understanding each of its balance sheet components, you can get a clear picture of your business’s financial health. From there you can decisions about the future growth potential.
The balance sheet and the liabilities section: Understanding the company’s obligations
The liabilities section decodes the company’s obligations. Similar to assets, liabilities bifurcate into two categories: current and non-current. The current liabilities are debts that need to be paid within one year. Whereas, non-current liabilities are debts that are due after one year.
Look at the liabilities section as the number of the business’s assets owed to creditors.
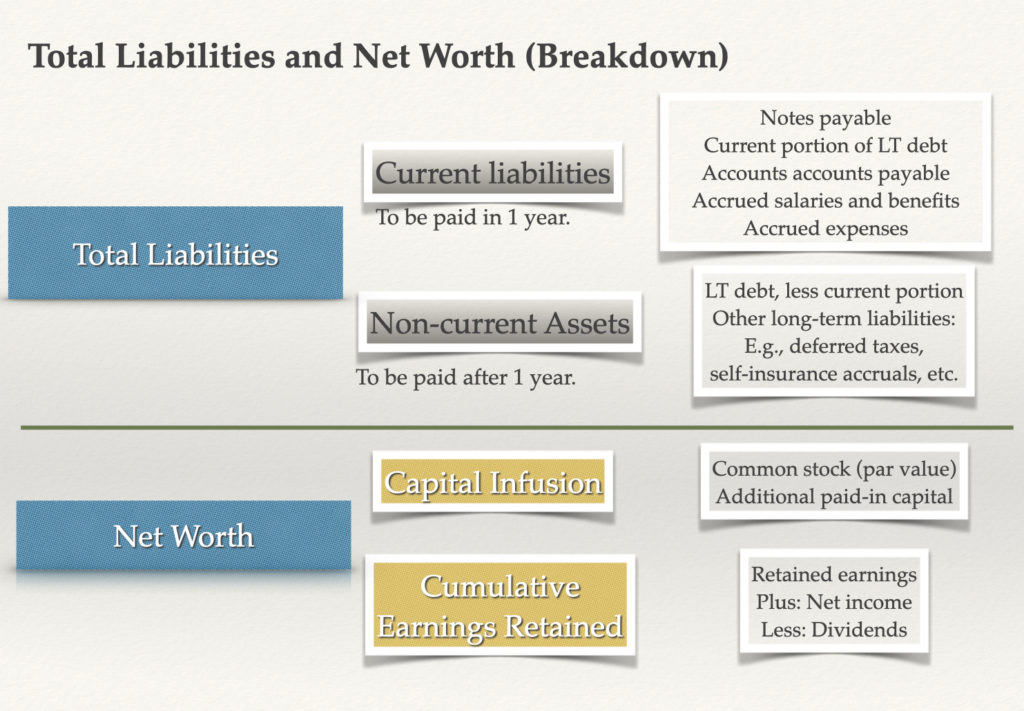
Current liabilities
Critical is understanding that current liabilities represent the business’s immediate debts that should be paid off quickly, within one year. Current liabilities include accounts payable, short-term loans due to banks, and payables to suppliers. Accrued liabilities refer to costs that have been incurred but not yet paid, such as employee benefits or taxes.
Essential current liability line items include:
- Accounts payable, which are the amounts owed to suppliers for goods or services
- Short-term debt is money that is due to be paid back within one year
- The current maturity of long-term debt is the portion of long-term debt due within one year.
- Accrued expenses include costs incurred but not yet paid
- Other current liabilities, which is a catch-all category for any other short-term debts not included in the above categories
Long-term liabilities
Long-term liabilities are debts that won’t be due for more than a year and include long-term loans and mortgages.
Looking at your company’s current liabilities, you can assess whether you have the cash on hand to meet these obligations. Conversely, you may need to take steps to generate more revenue or find other sources of funding.
Non-current liabilities
Non-current liabilities are the business’s long-term debts and other obligations not due within the following year. These include long-term loans, bonds payable, and deferred tax liability.
Essential non-current liabilities items include:
- Long-term debt includes money due in more than one year
- Bonds payable are long-term loans that the company has issued
- Deferred tax liability is the amount of taxes that the company owes in the future
- Other non-current liabilities, which is a catch-all category for any other long-term debts not included in the above categories
The Balance sheet and the equity section: Understanding the net residuals (net assets)
The shareholders’ equity section consists of several parts.
- Common stock represents how much each share of stock costs.
- Preferred stock is a type of stock that offers different rights to shareholders than common stock. Usually, preferred stocks pay regular dividends.
- Retained earnings encompass the company’s cumulative net profit net of dividends distributed to shareholders.
The balance sheet, how should you look at it?
Overall, the balance sheet is a valuable tool for understanding your company’s financial position and potential for growth. Tracking changes in assets, liabilities, and equity over time, you can gain insights into how well your business is performing. And where you might need to focus your efforts for future success.
The balance sheet, measuring the company’s liquidity
Liquidity means the ability to meet short-term obligations. Furthermore, this measures whether a company has enough short-term assets to cover its short-term obligations.
Determining working capital
Working capital measures a company’s liquidity. It looks at how many short-term assets the company has to meet the short-term obligation.
You subtract a company’s current liabilities from its current assets to calculate working capital. Thus the business has more current assets than liabilities, the positive working capital shows liquidity to meet current obligations.
Tracking working capital
Tracking changes in working capital over time, you can assess your company’s financial health. This will allow for identifying areas for growth or improvement. When working capital declines significantly, it may be a sign that the company is having trouble covering its expenses. Alternatively, if working capital increases significantly, it might be a sign that the company is generating more revenue than spending.
In either case, understand the underlying cause of working capital changes.
Performing liquidity ratio analysis
Both the current ratio and the quick ratio are essential measures of liquidity. Still, generally considered a more accurate measure the quick ratio excludes inventory from the calculation. The quick ratio is because total inventory can be difficult to sell quickly in a financial emergency. Thus, this makes it a less reliable source of liquid assets.
Current ratio
The current ratio is another measure of liquidity that looks at a company’s ability to pay its debts and other obligations as they come due. To calculate the current ratio, you divide a company’s total current assets by its current liabilities.
A current ratio of 1:1 means that a company has an equal amount of assets and liabilities. A current ratio higher than 1:1 indicates that the company has more assets than liabilities, while a current ratio calculated lower than 1:1 demonstrates that the company has more liabilities than assets.
Quick ratio
The quick ratio, also known as the acid test ratio, is a more stringent measure of liquidity than the current ratio. To calculate the quick ratio, subtract inventory from its total current assets and divide it by its current liabilities. The debt-to-equity ratio measures how much debt a company has compared to its equity. Furthermore, to calculate the debt-to-equity ratio, you divide a company’s total liabilities by its shareholders.
A quick ratio of 1:1 means that a company has an equal amount of liquid assets and liabilities. A quick ratio higher than 1:1 indicates that the company has more liquid assets than liabilities. In contrast, a quick ratio of less than 1:1 suggests that the company has more total liabilities than liquid assets.
The balance sheet and measuring the company’s solvency
Solvency means the overall ability to meet the company’s obligations and long-run viability. Measuring a company’s solvency allows you to assess its long-term financial health and identify areas for growth or improvement.
Many factors exist that can affect a company’s solvency. It is essential to continue monitoring these factors over time. Therefore, will allow you to understand the company’s financial health better and identify potential areas for improvement.
Performing leverage ratio analysis
One key measure of solvency is the debt-to-equity ratio, which compares a company’s total liabilities to its total equity.
To calculate this ratio, you divide a company’s total liabilities by its total equity. A lower debt-to-equity ratio indicates that a company is more financially stable, while a higher debt-to-equity ratio indicates that a company is more leveraged.
Performing interest coverage ratio analysis
Another critical measure of solvency is the interest coverage ratio, which measures a company’s ability to make its interest payments on time.
To calculate this ratio, you divide a company’s earnings before interest and taxes (EBIT) by its annual interest expense. A higher ratio indicates that the company has more earnings to cover its interest payments, while a lower ratio indicates that a company may be having trouble meeting its commitments.
Overall, understanding and measuring a company’s financial health is essential for making informed business decisions and taking action to improve its performance. By analyzing changes in working capital, key solvency ratios, and other metrics, you can gain valuable insights into a company’s financial health and identify areas for improvement.
Conclusion
The balance sheet components are critical for measuring a company’s financial health and performance. If interested in learning more about the balance sheet components and how to analyze them effectively, read our guide on breaking down the balance sheet. Overall, we discuss the current ratio, quick ratio, debt-to-equity ratio, and other critical measures of solvency and leverage that can help you assess a company’s financial health.
By understanding and analyzing the balance sheet, you can make more informed business decisions and take action to improve a company’s performance. So don’t wait. Start today!
The balance sheet and FAQs
What is the balance sheet, and what does it measure?
The balance sheet is a financial statement that summarizes a company’s assets, liabilities, and shareholder’s equity at a specific point in time. It measures a company’s overall financial health and performance by analyzing these components and tracking changes over time.
Why is it important to understand the balance sheet?
It is essential to understand the balance sheet because it provides insights into a company’s overall financial health and performance. By analyzing the balance sheet, you can make more informed business decisions and take action to improve a company’s financial position.
What are some of the critical components of the balance sheet?
Some of the critical components of the balance sheet include current assets, current liabilities, long-term assets, long-term liabilities, and shareholders’ equity.
What are some of the key ratios that measure a company’s financial health?
Thus, some of the key ratios that measure a company’s financial health include the debt-to-equity ratio and the interest coverage ratio.
What are some tips for analyzing the balance sheet?
Some tips for analyzing the balance sheet include understanding the current, quick, and debt-to-equity ratios. Additionally, it is essential to track changes in working capital, assets, liabilities, and equity to understand a company’s financial performance.
How can I learn more about analyzing the balance sheet?
To learn more about analyzing the balance sheet, check out our guide on breaking down the balance sheet. This guide discusses the current ratio, quick ratio, and debt-to-equity ratio. Notwithstanding, other vital measures of solvency and leverage will help you assess a company’s financial health.
By understanding and analyzing the balance sheet, you can gain valuable insights into a company’s financial health. Thus you can make more informed business decisions. So don’t wait. Start exploring the balance sheet today!

Courses Designed for You
Read the financial statements through:
Understanding the balance sheet, income statement, and cash flow statement, even if you have no experience with financial statements.
Interpret financial statements through:
Analyzing financial statements using profitability ratios i.e., Gross Margin (Cost of Goods Sold / Revenue), Operating Margin (EBITDA/ Revenue), Net Profit Margin (Net Income / Revenue), Return on Assets (Net Income / Assets), and Return on Equity (Net Income / Equity).
Gary Rushin is a certified public accountant. With over 40 years of experience, Gary Rushin’s depth and breadth of experience include investment and commercial banking, business insolvency and turnaround professional, and teaching executive MBA programs to name a few. Most recently, Gary successfully turnaround an insolvent 70-year-old manufacturing company winning numerous awards.